
What are CX Metrics?
Customer experience (CX) is a term used in the customer service industry that refers to the overall experience a customer has with a company. This includes all interactions the customer has with the company or its products, from the time they first learn about the company to the time they make a purchase or use a product or service.
CX metrics are a way to track and measure the customer experience. They can help companies determine how well they are satisfying customers and identify areas where they need to improve. There are many different CX metrics, and each company will have a different set that is most important to them.
CX metrics can be used to track the overall experience a customer has with a brand, or they can be used to track specific aspects of the customer experience, such as customer service, shipping & handling, website usability, or product quality.
The goal of using CX metrics is to accurately track and improve the customer experience which in turn will lead to increased customer loyalty and satisfaction. By tracking and measuring the customer experience, companies can identify areas where they need to make changes and improve the customer experience.
-1.png?width=605&name=Revised%20(2)-1.png)
Should You Measure all the CX Metrics?
Whether or not to measure all CX metrics is a question that often comes up for business leaders. The answer, as with most things, is it depends.
There are a variety of factors that should be considered when making this decision, including the company's size, customer base, and industry. Additionally, there are different types of CX metrics that can be measured, so it's important to figure out which ones are most important to your business. Once you've determined which metrics to measure, you need to set up a system to track them. This can be done manually or through a CX software platform.
The most important thing is to make sure that the data is being collected and analyzed in a way that can help you improve your customer experience. Otherwise, there's no point in measuring it.
So, should you measure all CX metrics? It depends. But, if you want to improve your customer experience, you should at least be measuring the most important ones.
How Do You Measure CX and What are the Most Popular CX Metrics?
There are many ways to measure customer experience (CX) metrics, and which ones you use will depend on your business goals and what you want to track. Here are some of the most common CX metrics:
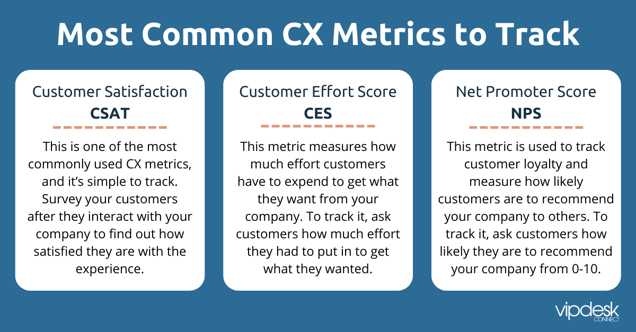
Customer Satisfaction (CSAT): This is one of the most commonly used CX metrics, and it’s simple to track. Survey your customers after they interact with your company to find out how satisfied they are with the experience.
Customer Effort Score (CES): This metric measures how much effort customers have to expend to get what they want from your company. To track it, ask customers how much effort they had to put in to get what they wanted.
Net Promoter Score (NPS): This metric is used to track customer loyalty and measure how likely customers are to recommend your company to others. To track it, ask customers how likely they are to recommend your company on a scale of 0-10.
These are just a few of the many CX metrics you can track. To determine which ones are most important to your business, you should start by asking yourself the question: What’s the goal of my customer experience strategy?
-
If you are going through an overhaul of your products and services, asking customers for CSAT feedback every step of the way can help you decide in real-time whether the changes are a good idea.
-
If you are looking to understand customer loyalty and how your brand is perceived overall, use NPS.
-
If you want to isolate and improve areas of customer friction, CES will be the best method for you.
How VIPdesk Measures CX Performance
At VIPdesk, we are always looking for ways to improve the customer experience (CX) we provide for our customers. We know that providing a great customer experience is essential to our success, and we are constantly looking for ways to measure and improve it.
There are a number of factors that go into measuring CX performance. Some of the most important CX metrics we use to evaluate the success of our customers and our programs are customer satisfaction, customer effort, and Net Promoter Score (NPS). VIPdesk continually monitors these factors and strives to improve them to provide the best possible customer experience. As we cannot apply all metrics at the same time, we normally utilize NPS as the core methodology for assessing the customer experience. NPS reflects the entire impression of a brand and the detractors that may be motivated by other factors outside the control of customer service such as delayed orders, product defects, or inaccurate website promotions. It is therefore necessary to understand the root cause for any negative experience.
By closely working with our clients on understanding NPS detractors and reducing the root causes for negative sentiments, we have been able to improve NPS with all our clients. VIPdesk has developed its own VIP Insights tool which can combine the many data points necessary to paint a full picture of the underlying reasons for negative or positive customer sentiments. Analyzing all data available and combining call recordings, survey data and any other media is a key step in modifying policies or any component of a brands marketing mix to achieve lasting CX performance improvements. Today, VIPdesk is so confident in this approach that we guarantee NPS improvements.
Comprehensive List of CX Metrics and KPIs to Evaluate the Success of Your Customer Support
- Customer Satisfaction (CSAT): Customer satisfaction (CSAT) is a measure of how pleased a customer is with a product or service. It is generally assessed on a scale from 1 to 5, with 1 being unsatisfied and 5 being very satisfied.
- NPS (Net Promotor Score): Net Promoter Score (NPS) is a customer loyalty metric that measures the willingness of customers to recommend a company’s products or services to others. It is calculated by subtracting the percentage of detractors (customers who said they would not recommend the company or product) from the percentage of promoters (customers who said they would recommend the company or product). NPS can range from -100 (every customer is a detractor) to 100 (every customer is a promoter).
- CES (Customer Effort Score): The customer effort score (CSE) is a metric that can be used to measure customer satisfaction. It is a numerical rating that is used to indicate how much effort a customer has to put in to get a problem resolved. The higher the CSE score, the less satisfied the customer is likely to be.
- Average Handle Time (AHT): It is the average time it takes to resolve a customer’s inquiry. Measuring and managing handle time is critical to ensuring that customers are getting the best possible service. There are a few different ways to measure handle time. One is to measure the time it takes from the moment a customer contacts us until the time we resolve their issue. Another is to measure the time it takes from the moment we receive the customer’s inquiry until the time we provide them with a resolution.
- Call Abandonment Rate: Call abandonment rate is a metric that measures the percentage of calls that are terminated by the caller before they are connected to a live agent. This metric can be used to help organizations understand how many potential customers are abandoning their calls, which can help identify areas where customer service needs improvement.
- Number of Calls / Calls Handled: The number of calls handled by a call center can be a good indicator of its efficiency and success. In order to improve the number of calls handled, a call center should aim to improve its response time, customer service, and overall efficiency. By improving these factors, a call center can handle more calls and provide a better customer experience.
- Service Level: A service level agreement (SLA) is a contract between a service provider and a customer that defines the level of service that the provider agrees to provide to the customer. The SLA typically specifies the service level objectives (SLOs) that the provider agrees to meet, such as availability, response time, and throughput. The SLA may also specify the penalties that the provider will incur if it fails to meet the SLOs.
- Customer Churn: Customer churn is a problem that all businesses must face. It is the natural process of customers leaving a company and can be caused by a number of factors, such as a lack of satisfaction with the product or service, the cost of the product or service, or the customer's need for a change.
- Call Resolution Time: Call Resolution Time is the amount of time that it takes your contact center agent to resolve the customer query. There are several factors that contribute to the low call resolution rate. One of the biggest factors is the lack of skilled employees. In many cases, the employees who are answering customer calls are not properly trained to handle the issue at hand.
- Customer Retention/ Retention Rate: Your retention rate is a measure of how well you are doing at keeping your customers. It is calculated by dividing the number of customers who have stayed with you by the total number of customers who have ever been a part of your business.
- Call Response Time: Your contact center’s call response time is one of the most important metrics that you can track. This metric measures the amount of time it takes for your contact center to answer a customer’s phone call.
- Agent Turnover/Turnover Rate: Agent turnover is a common challenge for many contact centers. When agents leave, it can impact service levels, customer satisfaction, and the organization's bottom line.
- Call Hold Time: There is no doubt that call hold time is one of the most frustrating aspects of customer service. Nobody enjoys being put on hold, and it can often feel like you're being ignored.
- First Contact Resolution (FCR): first contact resolution is the measure of how many customer inquiries or complaints are resolved upon the first contact with the customer. This metric is used to gauge the effectiveness of customer service.
- Percentage of Calls Blocked: The percentage of calls blocked is a statistic that is often overlooked, but it is a very important measure of the quality of a phone system. By understanding how many calls are being blocked, you can determine if your phone system is meeting your needs. There are a few different ways to calculate the percentage of calls blocked. One way is to divide the number of blocked calls by the total number of calls. Another way is to calculate the percentage of blocked calls out of the total number of calls that were attempted.
- Active Waiting Calls: In a call center, there are usually two types of waiting calls: active and passive. An active waiting call is a call that is currently in use by an agent, while a passive waiting call is a call that is on hold and not currently being used by an agent. There are a few factors that can affect the number of active waiting calls in a call center. One of the most important factors is the number of agents that are available to take calls. If the number of agents is low, then there will be more active waiting calls than if the number of agents is high. Another factor that can affect the number of active waiting calls is the type of call center. A contact center that handles a lot of inbound calls will have more active waiting calls than a contact center that handles a lot of outbound calls.
- Call Arrival Rate: Call arrival rate is the average number of calls that arrive per unit of time at a given point in a telecommunications network. It is a measure of the demand for service at a given point in time and can be used to help plan and manage telecommunications resources.
- Peak Hour Traffic: The lifeblood of any call center is the amount of traffic it can handle during peak hours. This is the time when the most customers are trying to reach out to customer service and the lines are busiest. If your call center isn't able to handle the peak hour traffic, then you're going to start to see a decrease in customer satisfaction. This is because customers are going to start to get frustrated with long wait times and being put on hold.
- Longest Hold Time Rate: The longest hold time rate is the average amount of time that a caller is on the phone with a customer service representative. This rate is usually measured in minutes or hours.
- Average Call Length: Call center average call length varies depending on the type of call, the industry, and the company. However, according to research, the average call center call length is about 4 minutes.
- Call Center Agent Utilization: The utilization of a call center agent is often reflective of the overall effectiveness of a call center. There are a number of factors that can influence call center agent utilization, including the number of incoming customer contacts, the average handle time (AHT) for each contact, and the number of agents on staff.
- Average Speed of Answer (ASA): The ASA is a valuable metric to help you understand how quickly your customers are getting help. It is the average time it takes from when a customer submits a ticket to when they receive their first response. This includes all tickets, not just those that are resolved. The ASA includes all channels, including phone, chat, and email.
- Call Transfer Rate: A call transfer rate is the number of times a call is transferred from one agent to another during a given time period. This rate is often used as a measure of customer satisfaction, as customers are typically more satisfied when their call is transferred quickly and without any disruption.
- Average After-call Work Time: When it comes to call center work, there is a lot of time that goes into after-call work. This is time that is not spent on the phone with a customer, but is instead used to follow up on that conversation, resolve any issues that may have come up, and generally just take care of the business that was conducted.